Where Does Money Go on the Days the AI Trade Breaks?
Chip stocks fell more than 3% on three sessions from October 8 to October 16, and consumer staples stocks rose on all three. XLPU and XLPD let traders take either side of that rotation one session at a time.
Chips Fell and Staples Rose Three Times in October
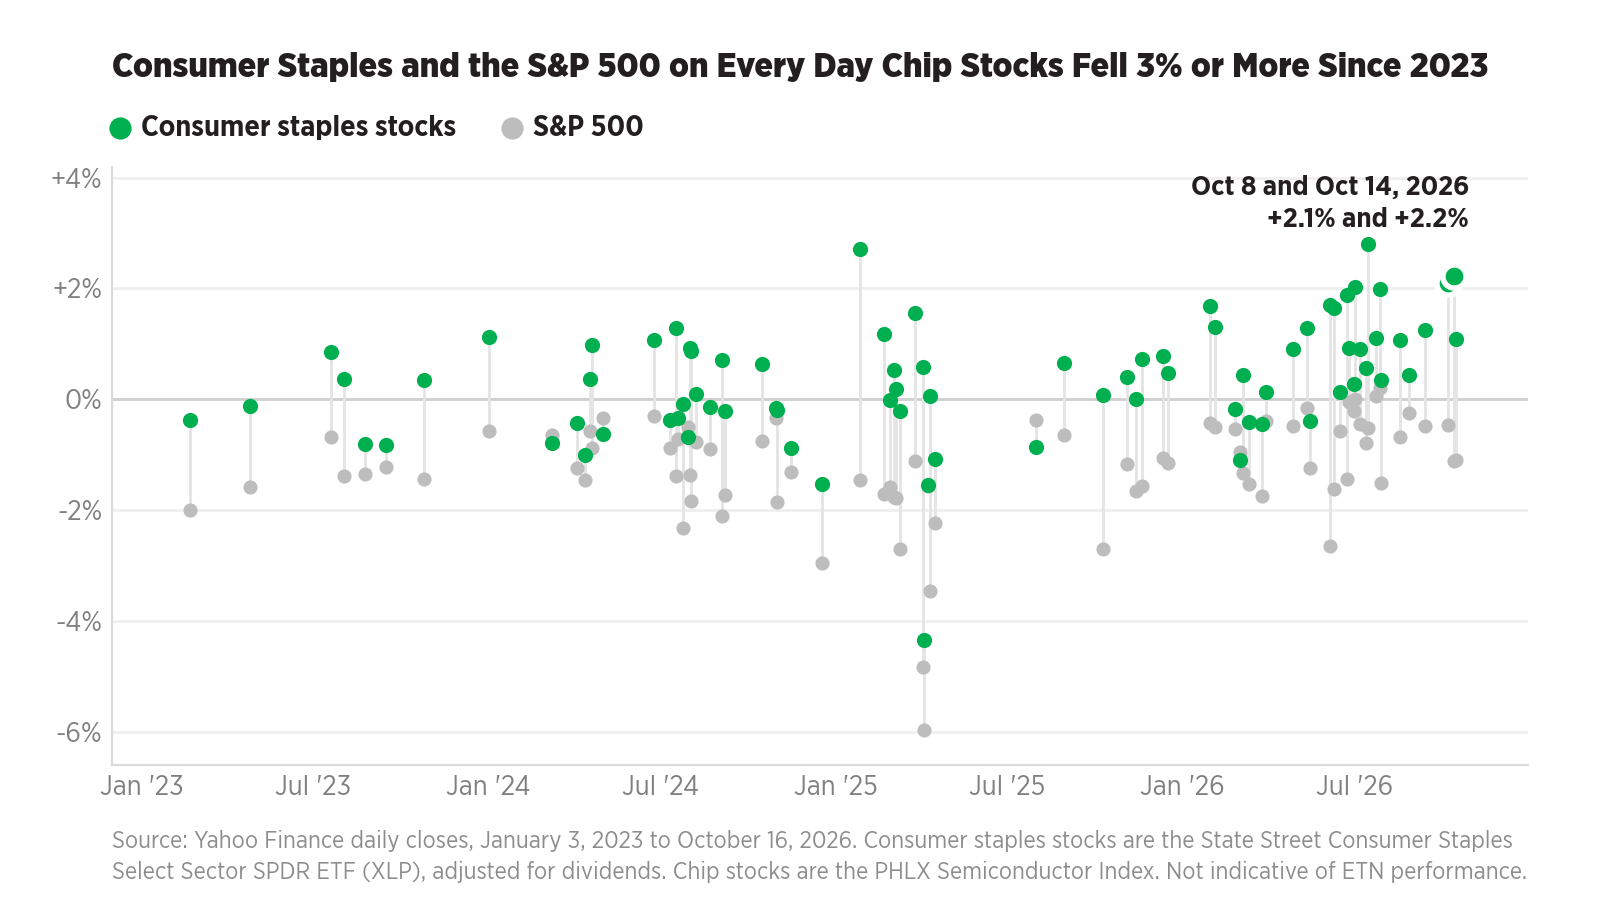
On Thursday, October 8, the PHLX Semiconductor Index fell 3.39%. The same day, consumer staples stocks rose 2.11%, while the S&P 500 slipped 0.47%.1
It happened again on Wednesday, October 14. September’s Consumer Price Index showed prices up 3.7% over 12 months, up from 3.4% in August.2 The chip index fell 4.30% that day, and staples rose 2.22%.1 On Friday, October 16, the chip index fell 3.83% and staples rose 1.08%.1
Over the seven sessions from the October 7 close to the October 16 close, staples gained 7.3%. The chip index lost 14.8%, and the S&P 500 fell 1.8%.1
Since the start of 2023, the chip index has fallen 3% or more and staples have risen 2% or more on the same day five times. Two of the five were October 8 and October 14.1
Moves like these are what XLPU and XLPD are built to trade. The MicroSectors™ 3× Long Consumer Staples (XLP) ETNs (XLPU) seek three times the daily performance of the VettaFi US Consumer Staples Fund-Tracking Index, and the MicroSectors™ -3× Short Consumer Staples (XLP) ETNs (XLPD) seek three times the inverse, both before fees and charges.8 That puts daily 3X exposure to the next big staples session within reach, long or short. The index is designed to track XLP, the State Street® Consumer Staples Select Sector SPDR® ETF, which is the staples measure used throughout this article.
Why Money Moves Into Staples When Chips Sell Off
Consumer staples companies sell food, drinks, toothpaste, detergent and the other things households buy every week whatever the economy is doing. Their sales do not depend on how much the largest technology companies spend on AI, so when investors pull money out of the AI trade, staples are one of the places some of it goes.
In October the sector also had a driver of its own. In February the Supreme Court struck down the tariffs imposed under the International Emergency Economic Powers Act (IEEPA), and importers that paid them are owed refunds.3 As of October 2, U.S. Customs and Border Protection had accepted about $136.6 billion in potential and certified refunds for processing.4 On October 8, the same day as the first chip selloff, the Court of International Trade certified a class of importers seeking refunds of the duties they paid.4
Large retailers and consumer brands import a great deal, and the refunds are starting to show up in their results. Costco reported a one-time benefit of $0.15 per share from IEEPA tariff refunds in the quarter it reported on September 24.5
XLPU offers 3X long daily exposure to the index for traders with a bullish view on consumer staples.
What Sends Money Back Out of Staples
The rotation can also run in reverse. Since the start of 2023, the chip index has risen 3% or more on 79 trading days. Staples fell on 40 of them and trailed the S&P 500 on 77.1
Staples also have reasons to fall that do not depend on chip stocks.
Grocery prices are rising more slowly than everything else. Food at home was up 1.8% over the 12 months to September, about half the 3.7% rise in prices overall.2 That leaves the companies that make and sell groceries less room to raise prices while their own costs climb.
Weight-loss drugs and trading down. The spread of GLP-1 weight-loss drugs has investors watching for smaller grocery baskets and fewer snacks. Shoppers moving from brand names to store brands put pressure on the companies that own the brands.
Tariff costs that remain. The refunds cover only the IEEPA duties. The Section 232 tariffs on steel and aluminum were not part of the Supreme Court case and remain in effect.6
XLPD offers 3X short daily exposure to the index for traders with a bearish view on consumer staples.
How Staples Have Traded on Chip Selloffs and CPI Days
The PHLX Semiconductor Index has fallen 3% or more on 81 trading days since the start of 2023. Staples rose on 51 of them and finished ahead of the S&P 500 on 76.1
CPI days have moved staples in both directions. Over the last two years staples rose on 11 CPI release days and fell on 12, and they moved an average of 0.86% on those days against 0.68% on all trading days. The 2.22% gain on October 14 was the largest CPI-day move of the period. The largest decline was 2.17%, on March 12, 2025.7
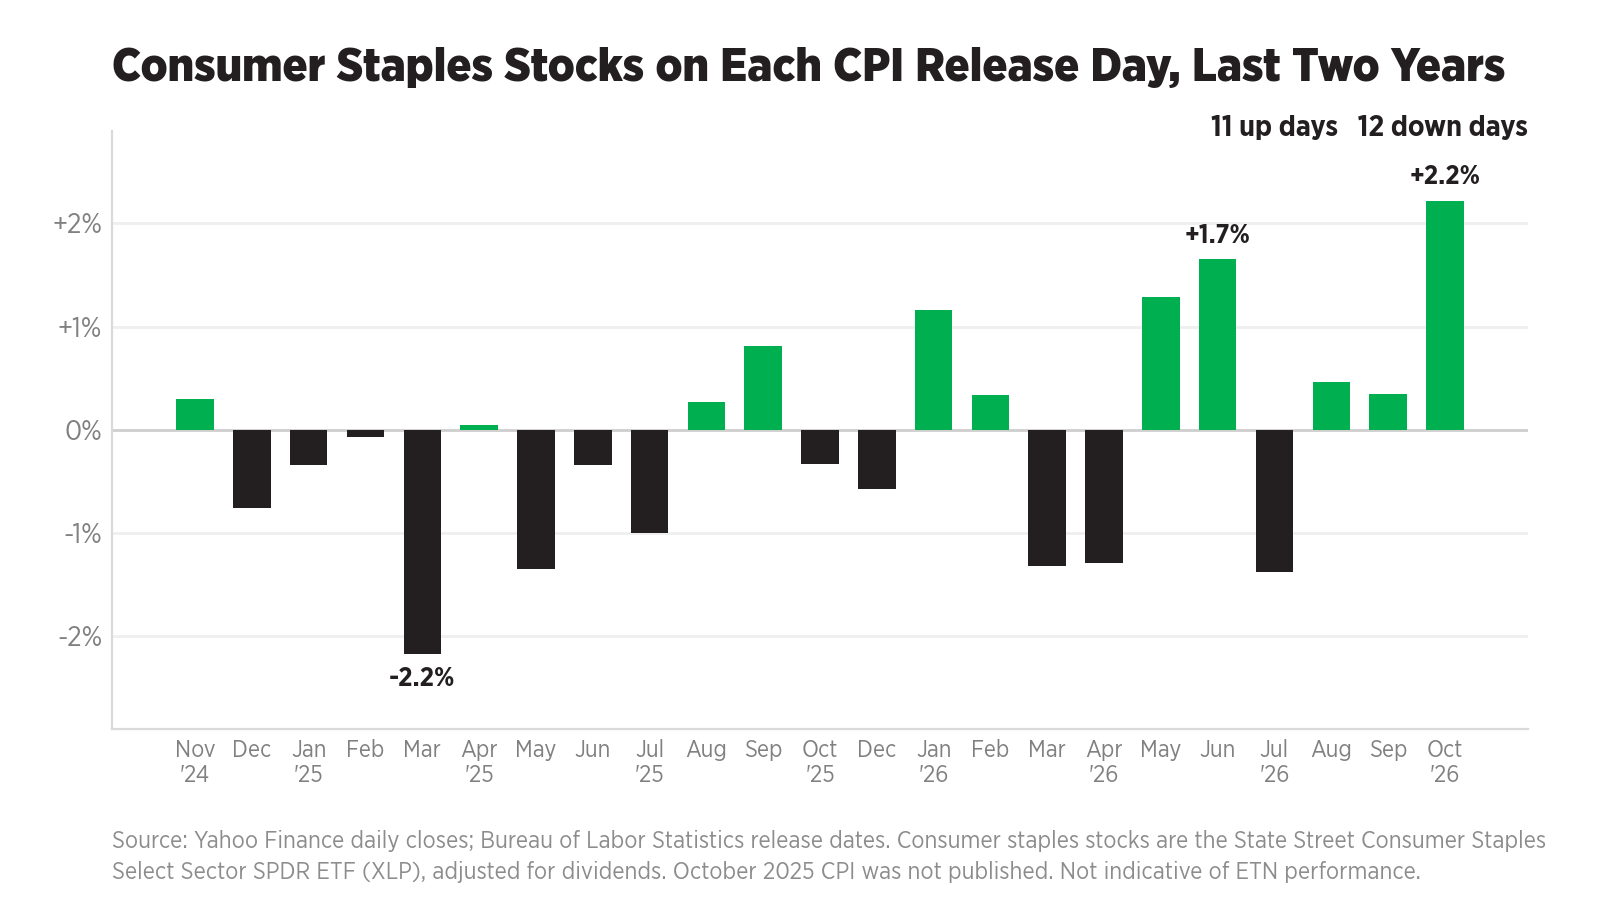
Days like these have become more common. Staples moved 2% or more in a single session nine times so far in 2026, three times as many as in 2023 and 2024 combined.1 XLPU is built for a trader who expects staples to rise on the next CPI day, and XLPD for one who expects them to fall.
Trade Consumer Staples 3X Long or Short, One Day at a Time
When traders have a view on where money goes the next time the AI trade breaks, how can they act on it beyond broad-market exposure or a single-stock trade?
XLPU and XLPD offer targeted daily 3X exposure to consumer staples, long or short. Both reset every day, so a trader can take a view on a single session and be flat at the close.
See XLPU, XLPD and the consumer staples suite at microsectors.com/consumer-staples.
Notes
1 MicroSectors analysis of daily closes from Yahoo Finance, January 3, 2023 to October 16, 2026. Consumer staples stocks are measured by the State Street® Consumer Staples Select Sector SPDR® ETF (XLP), adjusted for dividends; chip stocks by the PHLX Semiconductor Index; the S&P 500 by the S&P 500® Index. Not indicative of the performance of the Index or the ETNs.
2 U.S. Bureau of Labor Statistics, “Consumer Price Index News Release – September 2026,” released October 14, 2026. Twelve-month changes, not seasonally adjusted.
3 Supreme Court of the United States, decision of February 20, 2026, holding that IEEPA does not authorize the tariffs at issue.
4 U.S. Court of International Trade, Slip Op. 26-123 (October 8, 2026), certifying a class of importers that paid IEEPA duties, and citing U.S. Customs and Border Protection’s report of refunds accepted for processing in its Consolidated Administration and Processing of Entries (CAPE) system as of October 2, 2026. The class certification is subject to appeal.
5 Costco Wholesale Corporation, “Costco Wholesale Corporation Reports Fourth Quarter and Fiscal Year 2026 Operating Results,” September 24, 2026.
6 The tariffs imposed on steel, aluminum and certain derivative products under Section 232 of the Trade Expansion Act of 1962 were not before the Court in the IEEPA case.
7 MicroSectors analysis of daily closes from Yahoo Finance for the 23 CPI release dates from November 13, 2024 to October 14, 2026, from the Bureau of Labor Statistics release schedule. The October 2025 CPI was not published. Average move is the average absolute daily change; the all-days average covers October 14, 2024 to October 14, 2026.
8 Bank of Montreal pricing supplements for XLPU and XLPD dated September 9, 2026.
Risks and Disclosures
Sector concentration and index risk. The Index tracks a single fund that represents the consumer staples sector of the S&P 500® Index, and is therefore subject to the risks of investing in stocks in the consumer staples sector and to greater volatility than a more broadly diversified index. The Index tracks the market price of the Reference Fund, so the Reference Fund’s fees, any difference between its performance and that of the index it seeks to replicate, and any premium or discount between its market price and its net asset value are reflected in the Index and magnified by the ETNs’ leverage factor. The Index was launched on July 13, 2026.
Not buy-and-hold. The leveraged and inverse ETNs are intended to be daily trading tools for sophisticated investors to manage daily trading risks as part of an overall diversified portfolio. They are designed to achieve their stated investment objectives on a daily basis. You should proceed with extreme caution in considering an investment in those ETNs. Due to the effect of compounding, the performance of these ETNs over longer periods of time can differ significantly from the performance (or inverse of the performance) of their underlying index during the same period of time. The leveraged and inverse ETNs are not suitable for investors with longer-term investment objectives, and should be purchased only by sophisticated investors who do not intend to hold the ETNs as a buy and hold investment, who are willing to actively and continuously monitor their investment and who understand the consequences of investing in and of seeking daily resetting investment results. The ETNs are subject to intraday purchase risk. The Indicative Note Value of the leveraged and inverse ETNs is reset daily, and the leverage or exposure of the ETNs during any relevant trading day may be greater than or less than that contemplated by the name of a particular leveraged ETN.
Loss of investment. The ETNs do not guarantee any return of your investment. For example, with respect to some ETNs, if the closing Indicative Note Value or the Intraday Indicative Value (each as defined in the applicable pricing supplement) for the ETNs is equal to or less than $0 at any time during a relevant trading day, you will lose all of your investment in the ETNs. Even if the Index Closing Level has increased or decreased, as applicable, from the Initial Index Level, you may receive less than the principal amount of your ETNs upon a call, redemption, at maturity, or if you sell your ETNs, with the loss magnified by any leverage. Leverage (if applicable) increases the sensitivity of your ETNs to changes in the level of the applicable index.
Credit risk. The ETNs are senior, unsecured debt obligations of Bank of Montreal, and are subject to Bank of Montreal’s credit risk.
Where to read more. Bank of Montreal, the issuer of the ETNs, has filed a registration statement (including pricing supplements, product supplements, a prospectus supplement and a prospectus) with the Securities and Exchange Commission (the “SEC”) about each of the offerings to which this material relates. Please read those documents and the other documents relating to these offerings that Bank of Montreal has filed with the SEC for more complete information about Bank of Montreal and these offerings. These documents may be obtained without cost by visiting EDGAR on the SEC website at www.sec.gov, as well as at www.bmoetns.com and www.microsectors.com. Alternatively, Bank of Montreal, any agent or any dealer participating in these offerings will arrange to send the applicable pricing supplement, any applicable product supplement, the prospectus supplement and the prospectus if you so request by calling toll-free at 1-877-369-5412. Please see the “Risk Factors” section in the pricing supplement, any applicable product supplement, the prospectus supplement and the prospectus relating to the applicable offering.
Index licensor. The VettaFi US Consumer Staples Fund-Tracking Index (the “Index”) is a product of VettaFi LLC (together with its affiliates, “VettaFi”) and has been licensed for use for certain purposes by Bank of Montreal. The ETNs are not sponsored, endorsed, sold or promoted by VettaFi, and VettaFi makes no representation or warranty, express or implied, regarding the advisability of investing in the ETNs or the quality, accuracy or completeness of the Index. VettaFi shall have no liability for any errors, omissions or interruptions in the Index, or for any damages arising from the use of (or inability to use) the Index.
Non-endorsement. The ETNs are not sponsored, endorsed, sold or promoted by, and are in no way affiliated with, the issuer or sponsor of any fund that the Index is designed to track. The State Street® Consumer Staples Select Sector SPDR® ETF (XLP) is issued by the Select Sector SPDR® Trust, and its investment adviser is SSGA Funds Management, Inc. The ETNs are not sponsored, endorsed, sold or promoted by the Reference Fund, the Reference Fund Sponsor or the Trust, and none of them makes any representation regarding the advisability of investing in the ETNs. XLP and its trademarks are the property of their respective owners.
Company names. Company names and marks referenced herein are the property of their respective owners and are used for identification purposes only. Their inclusion does not imply any sponsorship, endorsement, affiliation or recommendation, and is not a recommendation to buy, sell or hold any security.
Trademarks and offering. MicroSectors™ and REX™ are registered trademarks of REX Shares, LLC (“REX”). The trademarks have been licensed for use for certain purposes by Bank of Montreal. The ETNs are not sponsored or sold by REX or any of its affiliates or third-party licensors. BMO Capital Markets Corp., an affiliate of the issuer, acts as the underwriter for the offerings of the ETNs. The ETNs are not insured by the FDIC, and may lose value.
Suitability. Investment suitability must be determined individually for each investor, and the ETNs are not suitable for all investors. This information is not intended to provide and should not be relied upon as providing accounting, legal, regulatory or tax advice. Investors should consult with their own financial advisors as to these matters.
Past performance. Historical results are neither an indicator nor a guarantee of future index performance or the return of the ETNs.