
Solactive FANG Innovation Index Rebalance Report: June 2025
The Solactive FANG Innovation Index includes 15 highly liquid stocks focused on building tomorrow’s technology today. These large, tech-enabled equity securities are all listed and domiciled in the U.S.
Index Rebalance Summary:
- MicroStrategy (MSTR) will replace Adobe (ADBE) in the Solactive FANG Innovation Index.
- The rebalance will take place on Friday, June 20, 2025, effective at market open Monday, June 23, 2025. The last rebalance was after the close on May 16, 2025.
- The Solactive FANG Innovation Index return year-to-date is 8.98% versus Nasdaq-100 Index return of 3.74%.
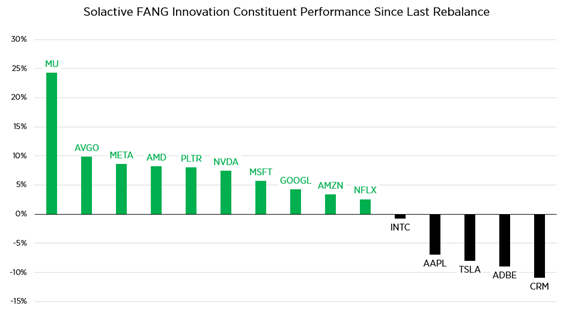
- Top performers since the last rebalance date were Micron (MU), Broadcom (AVGO), and Meta Platforms (META).
- The worst performers since the last rebalance date were Salesforce (CRM), Adobe (ADBE), and Tesla (TSLA).
Data as of 6/18/2025 close.
Solactive FANG Innovation Spotlight:
Source: Bloomberg L.P. data from 5/16/2014 to 6/18/2025.
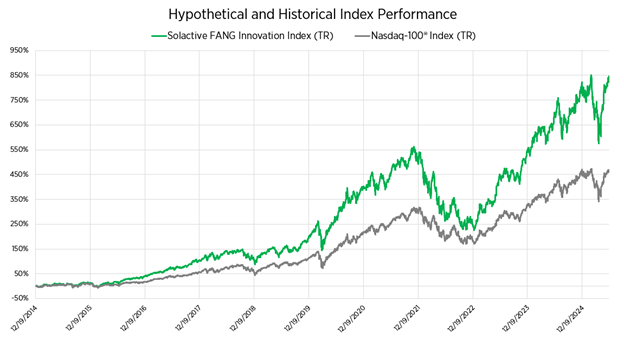
Source: Bloomberg L.P. data from 12/19/2014 to 6/18/2025. The Solactive FANG Innovation Index, an equal weighted index, was created by Solactive AG in 2021 and was launched on 6/8/2021. Index data prior to that date is hypothetical and reflects the application of the index methodology in hindsight. The hypothetical data cannot completely account for the impact of financial risk in actual trading. Past historical or hypothetical data is not a guarantee of future Index performance.
Solactive FANG Innovation Index Weightings:
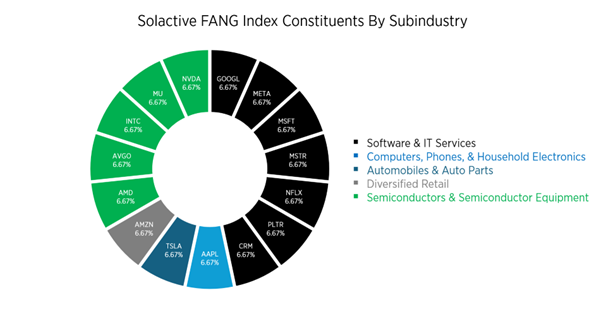
- As part of the ordinary adjustment, the composition pictured above will be implemented effective at the market open on June 23, 2025.
- The index rebalances quarterly, and reweights monthly. The Index’s underlying composition is equally weighted across all stocks, providing a unique benchmark that allows for a uniform performance-driven approach to investing. While market capitalization weighted indices can be dominated by a few of the largest stocks in the index, an equal weighting allows for a more diversified portfolio.
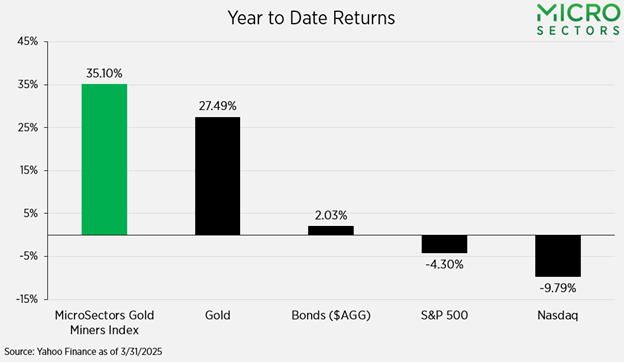
Gold Miners Up 35% in 2025: What’s Fueling the Boom?
Gold Miners are soaring through the first few months of 2025, pushing the Gold Miners Index up over 35% on a year-to-date basis, leaving the S&P 500’s decline in the dust. So, what is fueling this rally? Let’s dive in.
New Policies
In 2025, the most notable difference in the macro environment for U.S. investors is the new administration. Donald Trump is back in office and markets have taken notice of his tariff policies. On his first day in office, Trump signed an executive order developing reports on trade practices and tariff recommendations. In February, the first tariffs on Canada, Mexico, and China went into effect, along with other targeted tariffs. These tariffs have rattled markets, and stoked inflation fears. As a result, a wave of uncertainty has swept over investors, pushing demand for Gold as a safe-haven asset higher.
Inflation and the Rate-Cutting Cycle
The Federal Reserve began raising rates in 2022 after keeping them at nearly 0% for a couple of years in response to the pandemic. By May 2023, rates reached 5.00%-5.25%, the highest in 16 years, to combat inflation. After hiking rates, the Federal Reserve kicked off its cutting cycle in mid-2024. With rates now at 4.25%-4.50%, markets expect two to three more cuts by the year-end 2025. Lower rates reduce the opportunity cost of holding Gold, a non-yielding asset—supercharging its appeal.
Central Bank Buying and AI Boost Demand
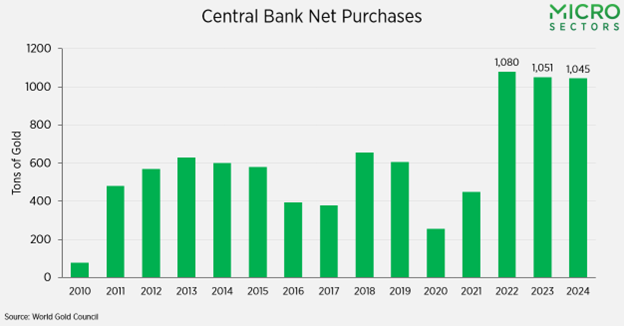
According to the World Gold Council, in 2024, Central Bank purchases of gold exceeded 1,000 tons for the third year in a row, signaling unwavering demand and pushing up gold prices. In addition to this, demand for gold for technology purposes grew 7% driven by AI’s reliance on gold for chips and circuitry. This dual demand surge is beneficial for miners, boosting revenues via higher gold prices.
How Gold Miners Can Outperform Spot Gold
The combination of factors, uncertainty surrounding tariffs, the Federal Reserve's interest rate-cutting cycle, steady demand from central banks, and emerging demand from the AI sector, is driving up the gold prices, breaking $3,000/oz for the first time in history earlier this month.
The surge in gold price is boosting Gold Miners by directly enhancing their revenues and profitability. In anticipation of increased revenues and profitability, Gold Mining stocks see their share prices rise as a result of increased demand from investors.
Gold Miners have fixed costs, like equipment and labor, which creates the dynamic that makes them leveraged to the price of gold. Here is an example of how this works:
- Gold at $1,500/oz, cost $1,200/oz = $300 profit.
- Gold at $2,000/oz, cost $1,200/oz = $800 profit.
- Result: A 33% price jump yields a 167% profit surge, making miners a leveraged bet on gold
Unlocking the Power of the Gold Miners Index
The S Network MicroSectors Gold Miners Index offers a robust entry point into the gold mining sector, blending stability with growth potential. It comprises two key components: the VanEck Gold Miners ETF, which accounts for 73% of the index and represents the world’s leading global gold mining companies, and the VanEck Junior Gold Miners ETF, constituting 27%, which focuses on small-cap firms actively engaged in gold and silver exploration and production. This strategic composition delivers a balanced exposure to both established industry leaders and agile, high-potential juniors, positioning investors to capitalize on the diverse dynamics of the gold mining landscape. Click here to learn more.
Important Information
S-Network Global Indexes, Inc. (“S-Network”) is the licensor of the S-Network MicroSectors™ Gold Miners Index. The MicroSectors ETNs tied to the index are not sponsored, endorsed, sold or promoted by S-Network, or its third-party licensors, in any way and makes no express or implied representation, guarantee or assurance with regard to: (a) the advisability in investing in the ETNs; (b) the quality, accuracy and/or completeness of the Index; and/or (c) the results obtained or to be obtained by any person or entity from the use of the Index. S-Network does not guarantee the accuracy and/or the completeness of the Index and shall not have any liability for any errors or omissions with respect thereto. Notwithstanding S-Network’s obligations to its licensees, S-Network reserves the right to change the methods of calculation or publication of the Index, and S-Network shall not be liable for any miscalculation of or any incorrect, delayed or interrupted publication with respect to the Index. S-Network shall not be liable for any damages, including, without limitation, any loss of profits or business, or any special, incidental, punitive, indirect or consequential damages suffered or incurred as a result of the use (or inability to use) of the Index.