Micron Earnings Sept 30: $54.2 Billion Quarter & the MicroSectors ETNs With MU Exposure
Micron reported $54.23 billion of revenue for its fiscal fourth quarter, above its $50 billion ± $1 billion guide, and guided to $61.5 billion for the next quarter. Here is what the report showed and how MU sits in the FANG+, MaNGoS+, FANG Innovation, and AI indices behind FNGU, FNGD, MNGU, BULZ, BERZ, AIQU, and AIQD.
What Micron Reported
Micron Technology reported results for its fiscal fourth quarter after the market closed on Wednesday, September 30, 2026.1
Revenue was $54.23 billion, above the top of the range Micron gave in June, which called for $50.0 billion, plus or minus $1.0 billion.2 Non-GAAP earnings were $33.42 per share against guidance of $31.00, plus or minus $1.00, and the non-GAAP gross margin was 87.0% against guidance of about 86%.3 Revenue for fiscal 2026 was $133.19 billion, against $37.38 billion for fiscal 2025, so the fourth quarter alone brought in more than all of fiscal 2025. The same quarter a year ago brought in $11.32 billion.4 The quarter had 14 weeks, one more than usual, because Micron’s fiscal 2026 was a 53-week year.5
Before the report, the analyst consensus compiled by Yahoo Finance called for revenue of $51.51 billion and non-GAAP earnings of $31.82 per share, as of September 30.6
What the Report Showed
- The outlook for next quarter. For the quarter ending in November, Micron guided revenue of $61.5 billion, plus or minus $1.5 billion, a non-GAAP gross margin of about 86.25%, and non-GAAP earnings of $38.15 per share, plus or minus $1.00.7 Before the report, analysts expected revenue of $57.93 billion and earnings of $35.92 per share for that quarter, as of September 30.8
- Data center demand. Revenue in Micron’s Core Data Center business unit was $18.00 billion, up from $11.52 billion the prior quarter, and revenue in its Cloud Memory business unit was $16.28 billion, up from $13.77 billion.9
- The Strategic Customer Agreements. Chairman and CEO Sanjay Mehrotra said the multi-year agreements “provide added confidence in the durability of Micron’s financial performance.”10
- Spending on new supply. Micron’s net capital expenditures were $10.77 billion for the quarter and $27.37 billion for fiscal 2026, and Mehrotra said Micron is “increasing our investments in technology, products and manufacturing.”11
Memory Stocks Have Surged This Year
Memory prices rose 80% to 90% in the first quarter of 2026 from the fourth quarter of 2025, across DRAM, NAND and high-bandwidth memory, according to Counterpoint Research. The contract price of a 64GB server memory module went from $450 to more than $900 over those three months.12
The surge comes from AI, as the largest cloud companies spend heavily on data centers: Amazon has guided roughly $220 billion of capital expenditure in 2026, Alphabet $180 to $190 billion, and Meta $130 to $145 billion.13 Counterpoint identified server memory as the main driver of the first-quarter price increase, and Micron said the same in June, crediting its record quarter to “the strategic value of memory in the AI era” and its customers’ “rapidly growing demand.”14
The memory makers’ shares have moved with those prices. Every stock in the group has at least doubled this year, against an 11.8% gain for the S&P 500.15
| Company | Return, 2026 through Sept. 30 |
|---|---|
| Micron Technology | +273.4% |
| SanDisk | +633.0% |
| Seagate Technology | +236.0% |
| SK hynix | +173.4% |
| Western Digital | +164.1% |
| Samsung Electronics | +124.6% |
| S&P 500 | +11.8% |
How Micron Has Traded After Earnings
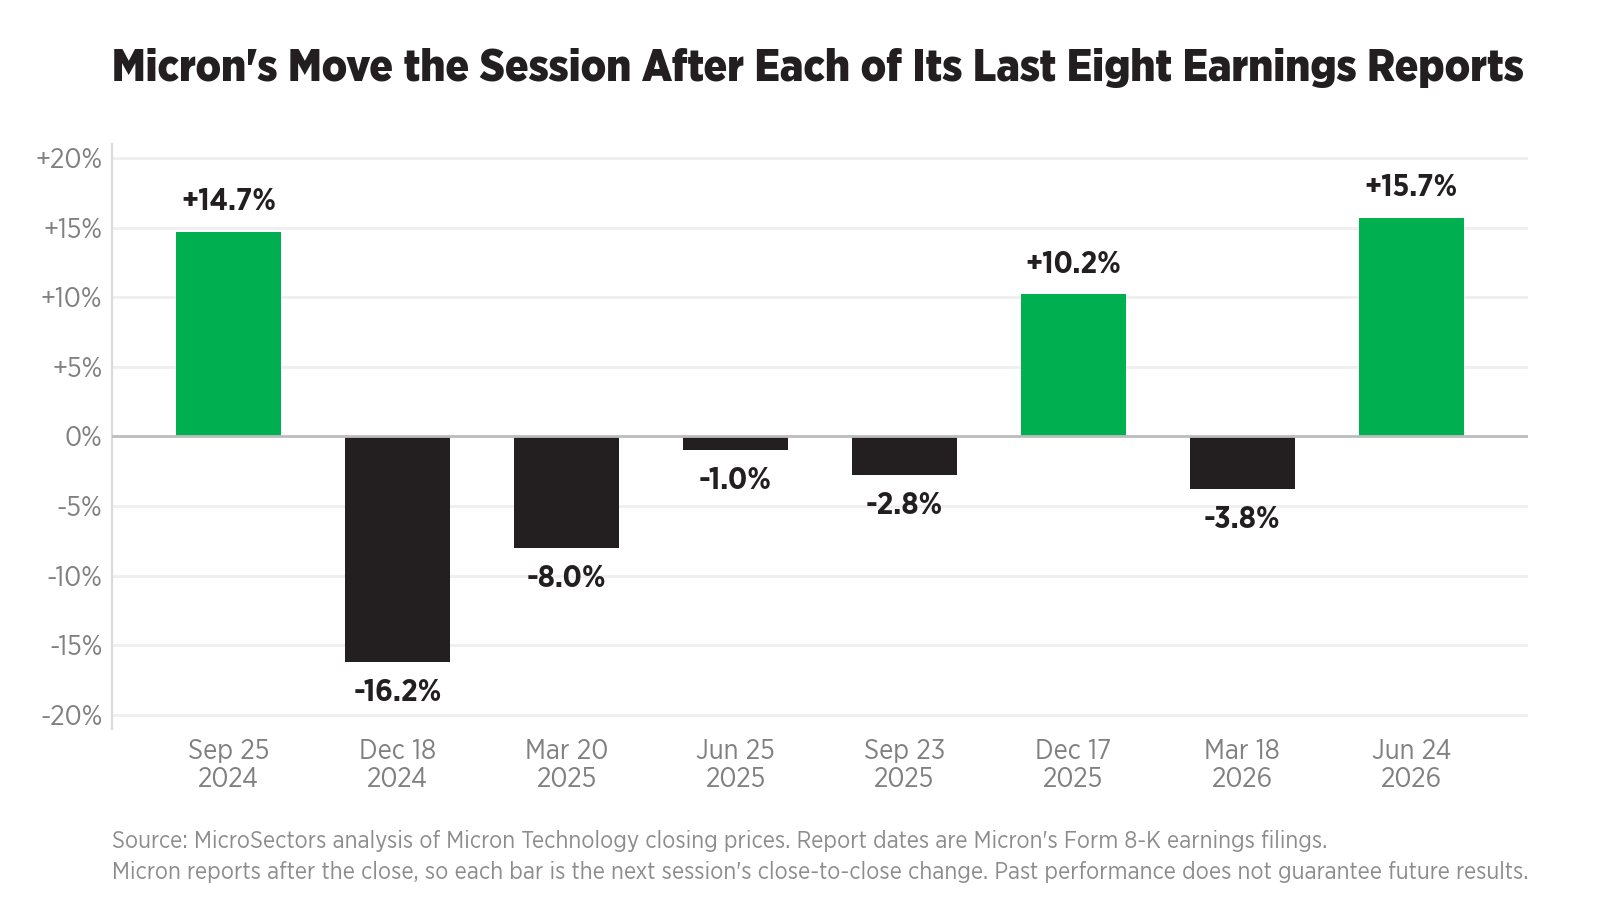
Over its eight reports before this one, Micron’s move in the following session averaged 9.0% in one direction or the other, against an average daily move of 3.3% over the same two years.16 It moved 8% or more on five of those eight sessions, three times up and twice down. After its previous report, on June 24, 2026, the stock rose 15.7%.
What Micron Has Meant for MicroSectors
Micron is up 273.4% this year through September 30, against 21.7% for the NYSE FANG+® Index and 11.8% for the S&P 500.17 Micron Technology contributed roughly 66% of the NYSE FANG+® Index’s gain this year, more than the other nine holdings combined.18
Micron is a holding in four indices that MicroSectors ETNs are linked to.19 The NYSE FANG+®, NYSE MaNGoS+ and Solactive FANG Innovation indices reset every holding to an equal weight at each reconstitution, so Micron’s weight drifts with its share price between those dates.
| Index | Micron’s weight, Sept. 28 | ETNs |
|---|---|---|
| NYSE FANG+® Index | 11.1% | FNGU, FNGD |
| NYSE MaNGoS+ Index | 10.8% | MNGU |
| Solactive FANG Innovation Index | 6.9% | BULZ, BERZ |
| BITA AI Leaders Select NTR US Index | 3.0% | AIQU, AIQD |
Trading Micron’s Report With MicroSectors ETNs
Each of these indices holds Micron alongside the companies that buy its memory and the companies that build the systems it goes into. The ETNs below let a trader take a view on the reaction to Micron’s report, and on the AI trade around it, at a multiple of the index’s daily move, long or short.
- FANG+. The MicroSectors™ FANG+™ Index 3X Leveraged ETNs (FNGU) and the MicroSectors™ FANG+™ Index -3X Inverse Leveraged ETNs (FNGD) offer three times, and three times the inverse of, the daily performance of the NYSE FANG+® Index. microsectors.com/fang
- MaNGoS+. The MicroSectors™ 3X Long MANGOS+ ex Private Companies ETNs (MNGU) offer three times the daily performance of the NYSE MaNGoS+ Index. microsectors.com/mangos
- FANG & Innovation. The MicroSectors™ Solactive FANG & Innovation 3X Leveraged ETNs (BULZ) and the MicroSectors™ Solactive FANG & Innovation -3X Inverse Leveraged ETNs (BERZ) offer three times, and three times the inverse of, the daily performance of the Solactive FANG Innovation Index. microsectors.com/fang-innovation
- Artificial Intelligence. The MicroSectors™ 3X Long Artificial Intelligence (AI) ETNs (AIQU) and the MicroSectors™ -3X Short Artificial Intelligence (AI) ETNs (AIQD) offer three times, and three times the inverse of, the daily performance of the BITA AI Leaders Select NTR US Index. microsectors.com/ai
The ETNs are linked to these indices, not to Micron’s shares, so they will not move three times Micron’s share price. Each index moves on all of its holdings, and Micron’s report is one input to the day’s move.
Notes
1 Micron Technology, Inc., fiscal fourth quarter and full year 2026 earnings release, September 30, 2026. Guidance is a company estimate, not an actual result. Non-GAAP figures exclude stock-based compensation and certain other items that are included under U.S. generally accepted accounting principles (GAAP).
2 Micron Technology, Inc., “Micron Technology, Inc. Reports Record Results for the Third Quarter of Fiscal 2026,” Form 8-K Exhibit 99.1 filed with the SEC on June 24, 2026. Guidance is a company estimate, not an actual result. Non-GAAP figures exclude stock-based compensation and certain other items that are included under U.S. generally accepted accounting principles (GAAP).
3 Micron Technology, Inc., fiscal fourth quarter and full year 2026 earnings release, September 30, 2026. Guidance is a company estimate, not an actual result. Non-GAAP figures exclude stock-based compensation and certain other items that are included under U.S. generally accepted accounting principles (GAAP).
4 Micron Technology, Inc., “Micron Technology, Inc. Reports Results for the Fourth Quarter and Full Year of Fiscal 2025,” Form 8-K Exhibit 99.1 filed with the SEC on September 23, 2025.
5 Micron Technology, Inc., Form 10-Q for the quarter ended May 28, 2026, filed with the SEC on June 25, 2026: “Fiscal 2026 contains 53 weeks and fiscal 2025 contains 52 weeks. The third quarter of 2026 contains 13 weeks and the fourth quarter of 2026 contains 14 weeks.”
6 Yahoo Finance analyst consensus for Micron Technology, as of September 30, 2026, before Micron’s report: fiscal fourth quarter 2026 (quarter ending August 2026), mean revenue estimate of 35 analysts and mean non-GAAP EPS estimate of 33 analysts; fiscal first quarter 2027 (quarter ending November 2026), mean revenue estimate of 31 analysts and mean EPS estimate of 32 analysts. Estimates are third-party forecasts, change over time, and are not a guarantee of results.
7 Micron Technology, Inc., fiscal fourth quarter and full year 2026 earnings release, September 30, 2026. Guidance is a company estimate, not an actual result. Non-GAAP figures exclude stock-based compensation and certain other items that are included under U.S. generally accepted accounting principles (GAAP).
8 Yahoo Finance analyst consensus for Micron Technology, as of September 30, 2026, before Micron’s report: fiscal fourth quarter 2026 (quarter ending August 2026), mean revenue estimate of 35 analysts and mean non-GAAP EPS estimate of 33 analysts; fiscal first quarter 2027 (quarter ending November 2026), mean revenue estimate of 31 analysts and mean EPS estimate of 32 analysts. Estimates are third-party forecasts, change over time, and are not a guarantee of results.
9 Micron Technology, Inc., fiscal fourth quarter and full year 2026 earnings release, September 30, 2026. Guidance is a company estimate, not an actual result. Non-GAAP figures exclude stock-based compensation and certain other items that are included under U.S. generally accepted accounting principles (GAAP).
10 Micron Technology, Inc., fiscal fourth quarter and full year 2026 earnings release, September 30, 2026. Guidance is a company estimate, not an actual result. Non-GAAP figures exclude stock-based compensation and certain other items that are included under U.S. generally accepted accounting principles (GAAP).
11 Micron Technology, Inc., fiscal fourth quarter and full year 2026 earnings release, September 30, 2026. Guidance is a company estimate, not an actual result. Non-GAAP figures exclude stock-based compensation and certain other items that are included under U.S. generally accepted accounting principles (GAAP).
12 Counterpoint Research, “Memory Prices Surge Up to 90% From Q4 2025,” Memory Price Tracker, February 2026.
13 Amazon 2026 capital expenditure guidance from its second quarter 2026 earnings call, July 30, 2026. Alphabet 2026 guidance from its first quarter 2026 earnings release, SEC Form 8-K Exhibit 99.1. Meta Platforms 2026 guidance of $130 to $145 billion, including principal payments on finance leases, from its second quarter 2026 earnings release, SEC Form 8-K Exhibit 99.1 filed July 29, 2026. Guidance is a company estimate, not an actual result.
14 Micron Technology, Inc., “Micron Technology, Inc. Reports Record Results for the Third Quarter of Fiscal 2026,” Form 8-K Exhibit 99.1 filed with the SEC on June 24, 2026. Guidance is a company estimate, not an actual result.
15 Returns from the December 31, 2025, close to the September 30, 2026, close, adjusted for dividends. SK hynix and Samsung Electronics are Korea Exchange listings in Korean won. S&P 500 is price return.
16 MicroSectors analysis of Micron Technology closing prices, adjusted for dividends. Report dates are the filing dates of Micron’s Form 8-K earnings releases from September 25, 2024, to June 24, 2026. Micron reports after the close, so each figure is the close-to-close change in the following session. The average daily move is the mean absolute close-to-close change over every session from September 26, 2024, to September 30, 2026.
17 Returns from the December 31, 2025, close to the September 30, 2026, close. Micron is adjusted for dividends. NYSE FANG+® Index and S&P 500 figures are price return. The ETNs are linked to the gross total return version of the NYSE FANG+® Index.
18 MicroSectors analysis of NYSE FANG+® Index constituent returns from the December 31, 2025, close to the September 30, 2026, close. Contribution is calculated by resetting each constituent to a 10% weight at each quarterly reconstitution, applying the constituents held in each period, and compounding across periods.
19 Index weights from the Bank of Montreal start-of-day composition files dated September 28, 2026. Weights change with prices and at each reconstitution or rebalance.
Risks and Disclosures
Concentration and index risk. Each Index is concentrated in a limited number of companies and is therefore subject to greater volatility and greater risk of loss than a more broadly diversified index. Index constituents and their weights are as of the date shown and are subject to change at each reconstitution or rebalance. A limited number of index constituents may affect the Index Closing Level, and an Index is not necessarily representative of its focus industry. An index constituent may be replaced upon the occurrence of certain events.
Not buy-and-hold. The leveraged and inverse ETNs are intended to be daily trading tools for sophisticated investors to manage daily trading risks as part of an overall diversified portfolio. They are designed to achieve their stated investment objectives on a daily basis. You should proceed with extreme caution in considering an investment in those ETNs. Due to the effect of compounding, the performance of these ETNs over longer periods of time can differ significantly from the performance (or inverse of the performance) of their underlying index during the same period of time. The leveraged and inverse ETNs are not suitable for investors with longer-term investment objectives, and should be purchased only by sophisticated investors who do not intend to hold the ETNs as a buy and hold investment, who are willing to actively and continuously monitor their investment and who understand the consequences of investing in and of seeking daily resetting investment results. The ETNs are subject to intraday purchase risk. The Indicative Note Value of the leveraged and inverse ETNs is reset daily, and the leverage or exposure of the ETNs during any relevant trading day may be greater than or less than that contemplated by the name of a particular leveraged ETN.
Loss of investment. The ETNs do not guarantee any return of your investment. For example, with respect to some ETNs, if the closing Indicative Note Value or the Intraday Indicative Value (each as defined in the applicable pricing supplement) for the ETNs is equal to or less than $0 at any time during a relevant trading day, you will lose all of your investment in the ETNs. Even if the Index Closing Level has increased or decreased, as applicable, from the Initial Index Level, you may receive less than the principal amount of your ETNs upon a call, redemption, at maturity, or if you sell your ETNs, with the loss magnified by any leverage. Leverage (if applicable) increases the sensitivity of your ETNs to changes in the level of the applicable index.
Credit risk. The ETNs are senior, unsecured debt obligations of Bank of Montreal, and are subject to Bank of Montreal’s credit risk.
Where to read more. Bank of Montreal, the issuer of the ETNs, has filed a registration statement (including pricing supplements, product supplements, a prospectus supplement and a prospectus) with the Securities and Exchange Commission (the “SEC”) about each of the offerings to which this material relates. Please read those documents and the other documents relating to these offerings that Bank of Montreal has filed with the SEC for more complete information about Bank of Montreal and these offerings. These documents may be obtained without cost by visiting EDGAR on the SEC website at www.sec.gov, as well as at www.bmoetns.com and www.microsectors.com. Alternatively, Bank of Montreal, any agent or any dealer participating in these offerings will arrange to send the applicable pricing supplement, any applicable product supplement, the prospectus supplement and the prospectus if you so request by calling toll-free at 1-877-369-5412. Please see the “Risk Factors” section in the pricing supplement, any applicable product supplement, the prospectus supplement and the prospectus relating to the applicable offering.
Index licensors. ICE Data Indices, LLC (“IDI”) is the licensor of the NYSE® FANG+® Index and the NYSE® MaNGoS+ Index; trademarks of Intercontinental Exchange, Inc. and its affiliates include ICE, NYSE and New York Stock Exchange. Solactive AG is the licensor of the Solactive FANG Innovation Index. BITA GmbH (“BITA”) is the licensor of the BITA AI Leaders Select NTR US Index and calculates, administers and publishes that Index. The ETNs are not sponsored, endorsed, sold or promoted by any of these index licensors, none of which makes any representation, guarantee or assurance regarding the advisability of investing in the ETNs or the quality, accuracy or completeness of any index, and none of which shall have any liability for any errors, omissions or interruptions in any index or for any damages arising from the use of (or inability to use) any index.
Company names. Company names and marks referenced herein are the property of their respective owners and are used for identification purposes only. Their inclusion does not imply any sponsorship, endorsement, affiliation or recommendation, and is not a recommendation to buy, sell or hold any security.
Trademarks and offering. MicroSectors™ and REX™ are registered trademarks of REX Shares, LLC (“REX”). The trademarks have been licensed for use for certain purposes by Bank of Montreal. The ETNs are not sponsored or sold by REX or any of its affiliates or third-party licensors. BMO Capital Markets Corp., an affiliate of the issuer, acts as the underwriter for the offerings of the ETNs. The ETNs are not insured by the FDIC, and may lose value.
Suitability. Investment suitability must be determined individually for each investor, and the ETNs are not suitable for all investors. This information is not intended to provide and should not be relied upon as providing accounting, legal, regulatory or tax advice. Investors should consult with their own financial advisors as to these matters.
Past performance. Historical results are neither an indicator nor a guarantee of future index performance or the return of the ETNs. Micron’s past contribution to an index’s return does not indicate its future contribution.
Recent Posts